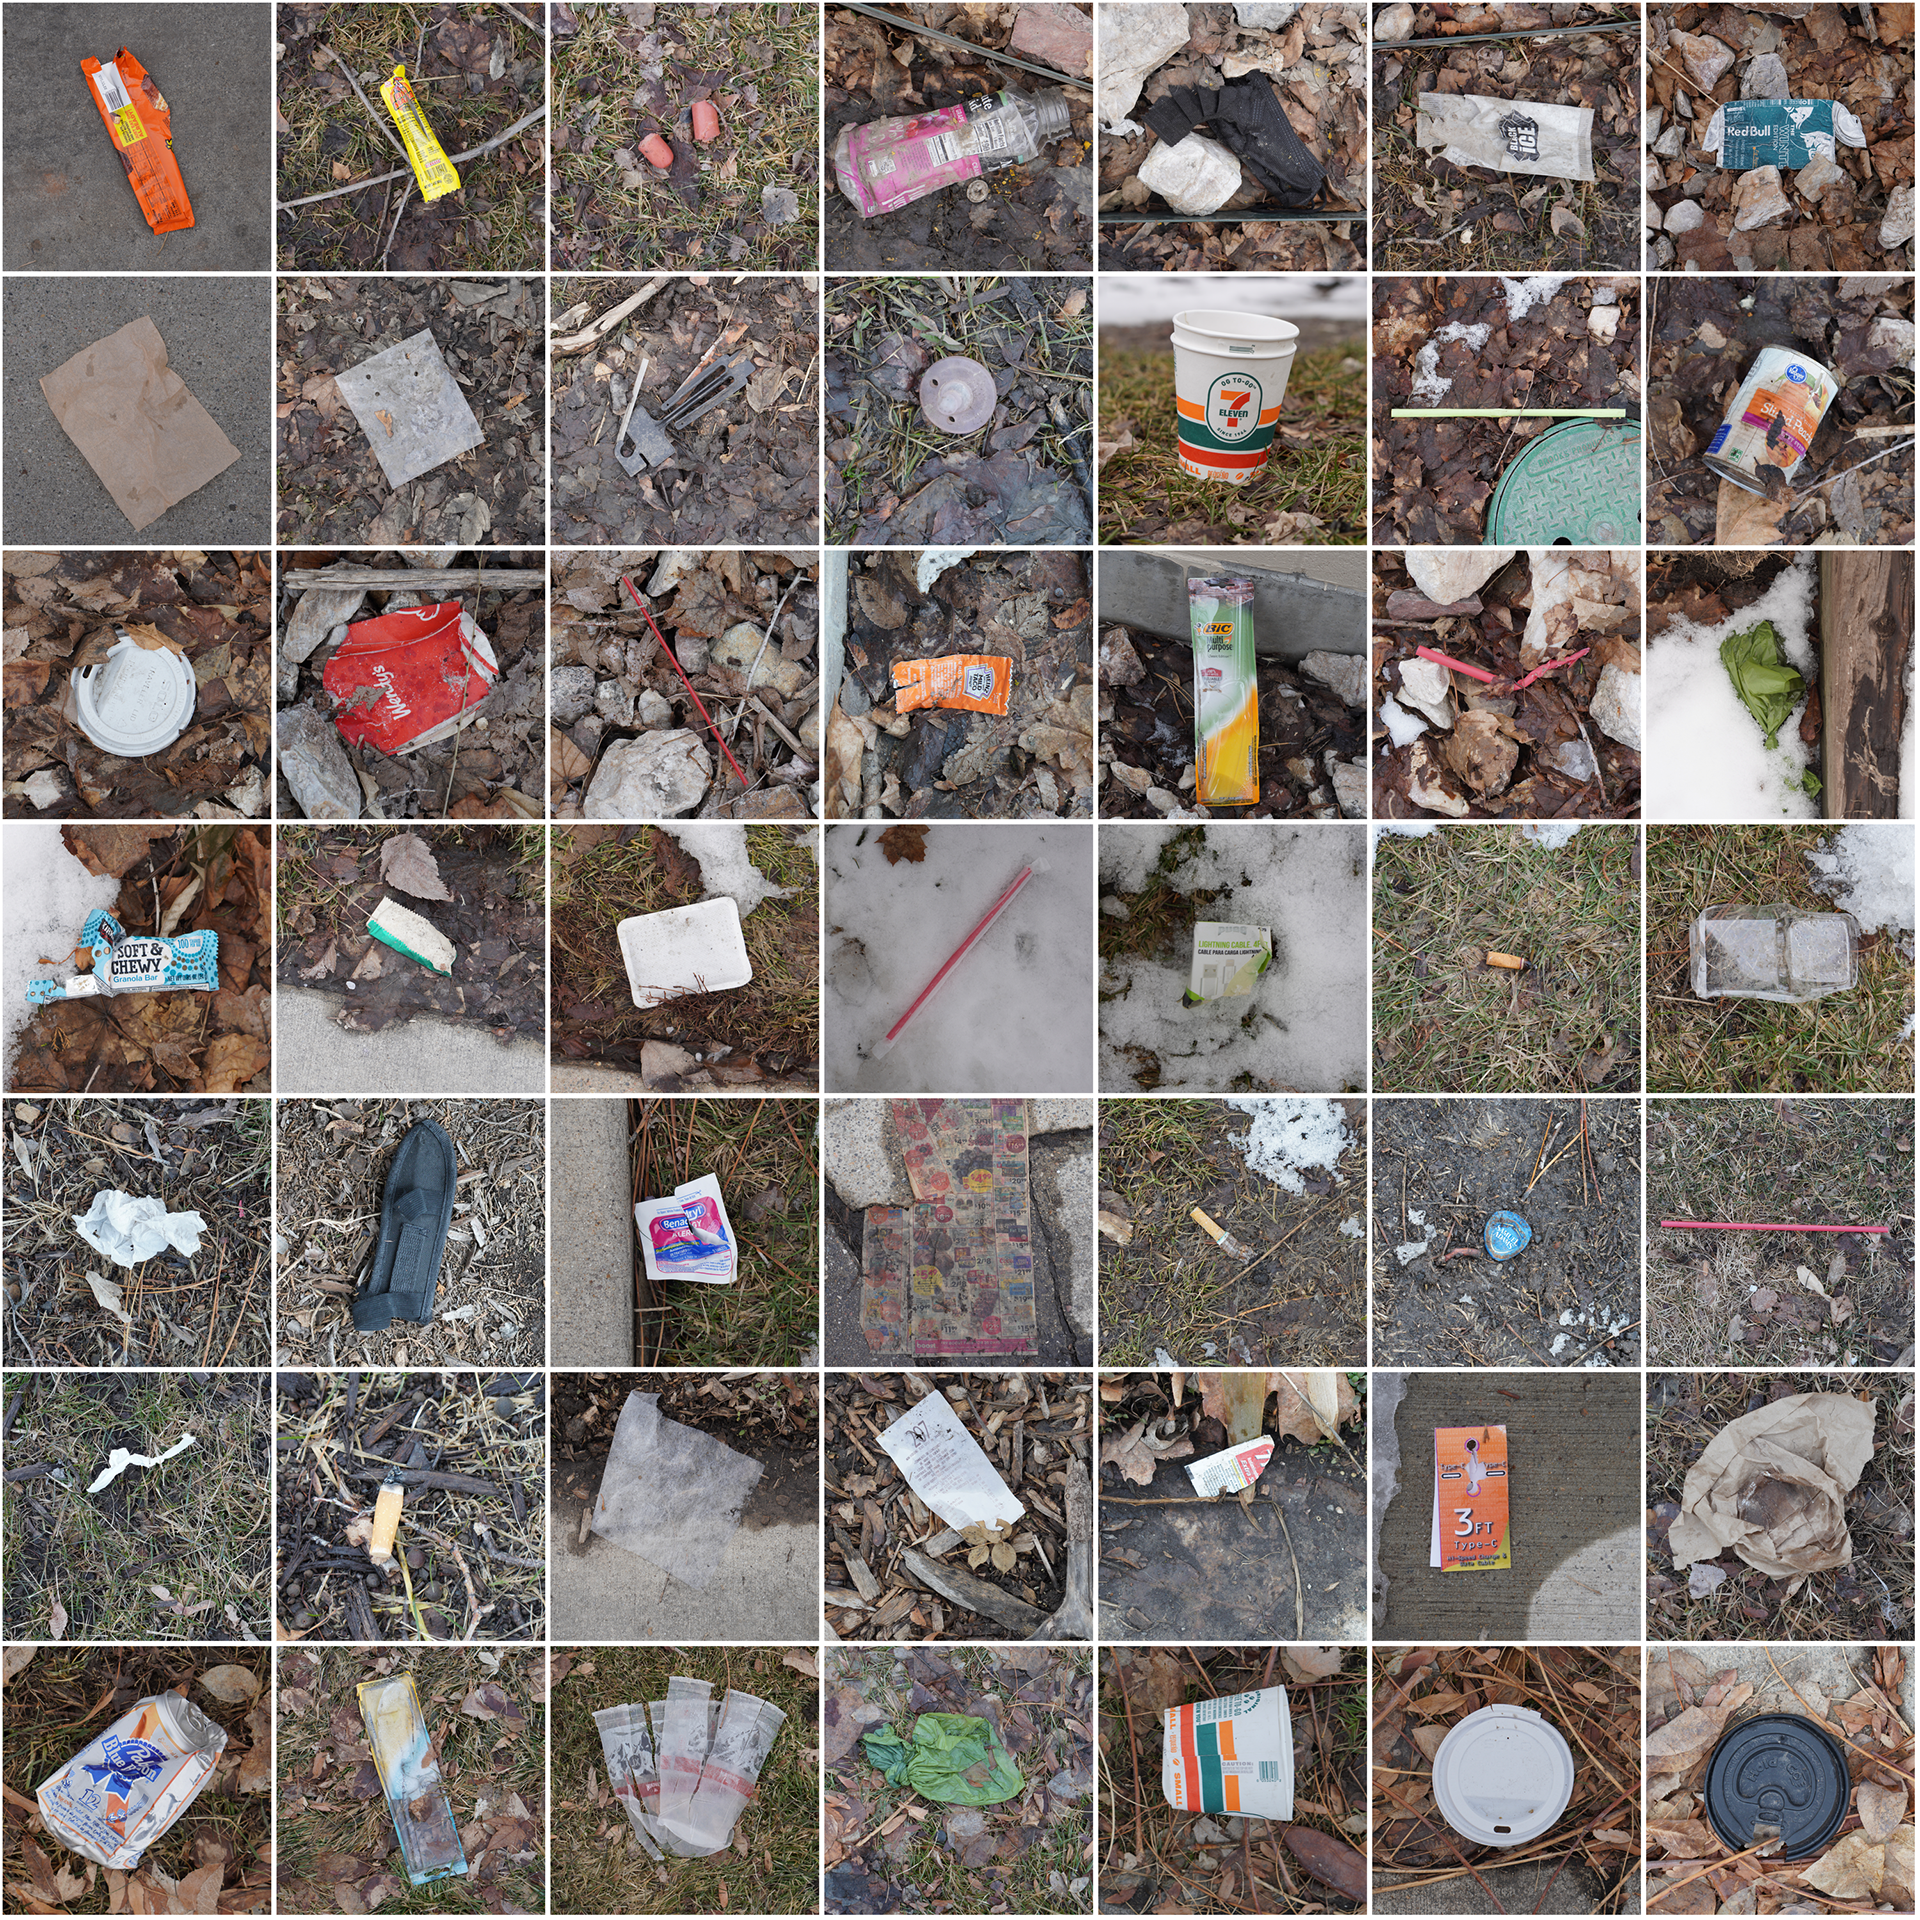
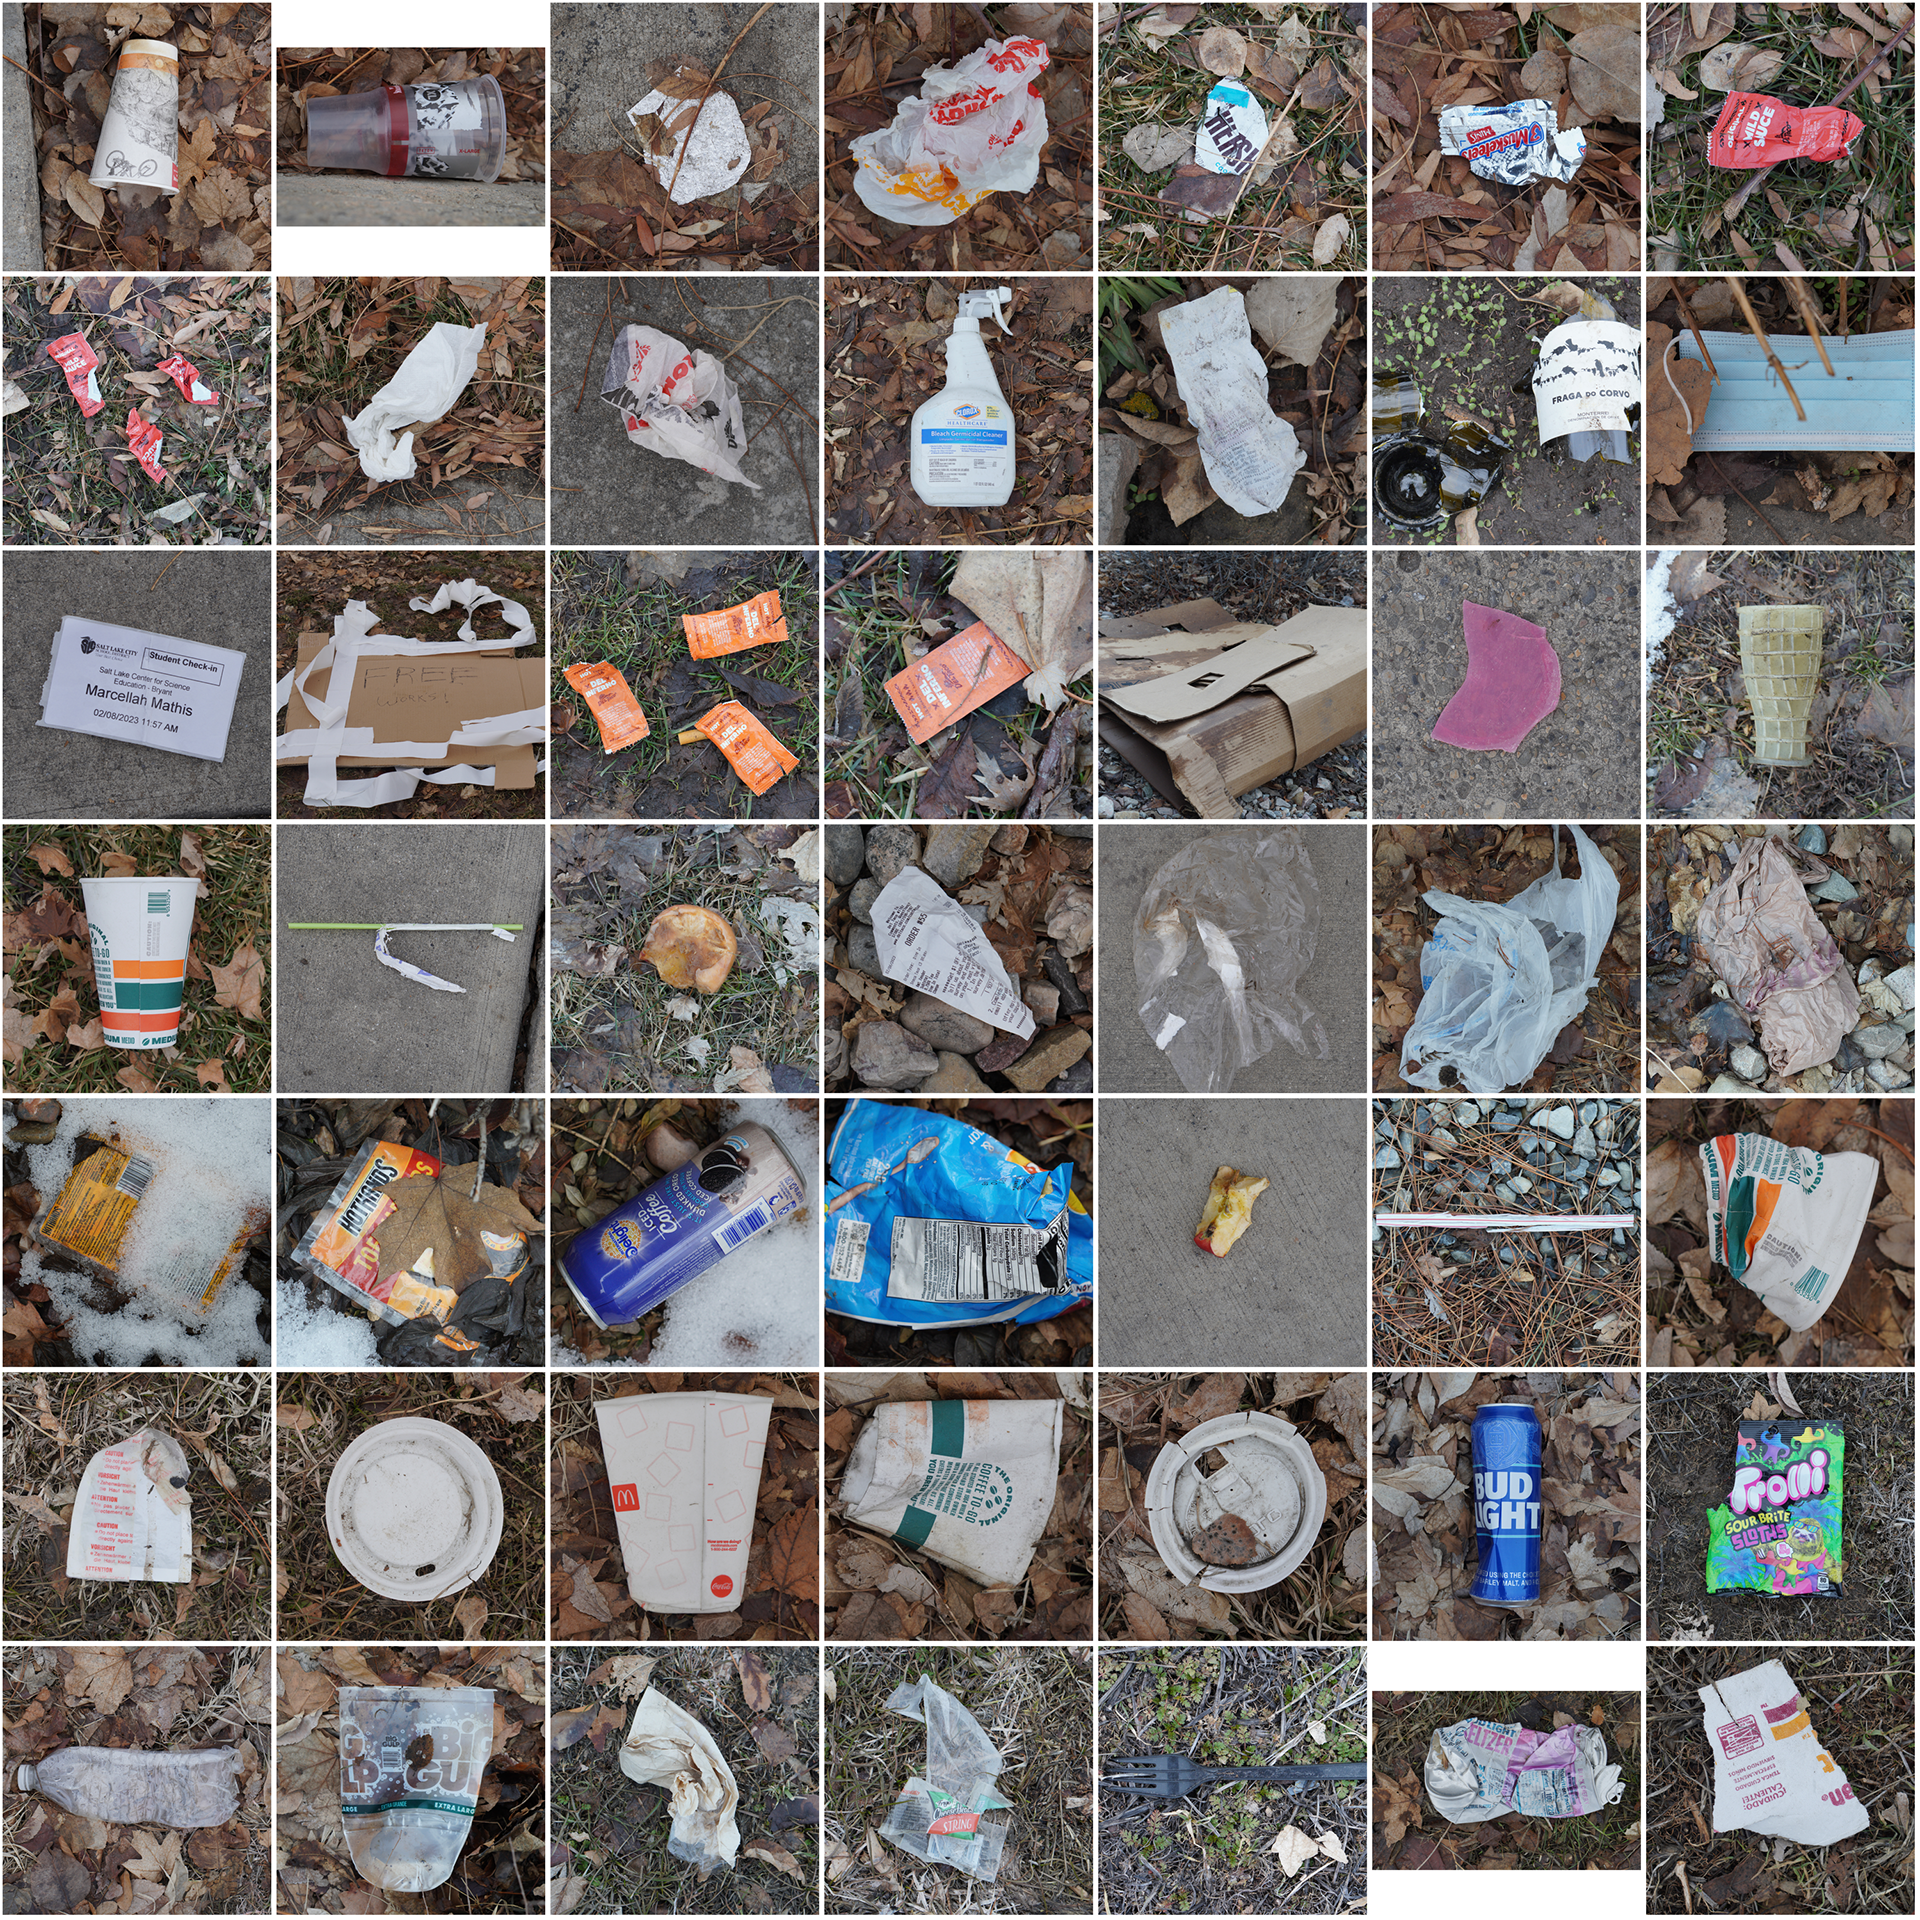
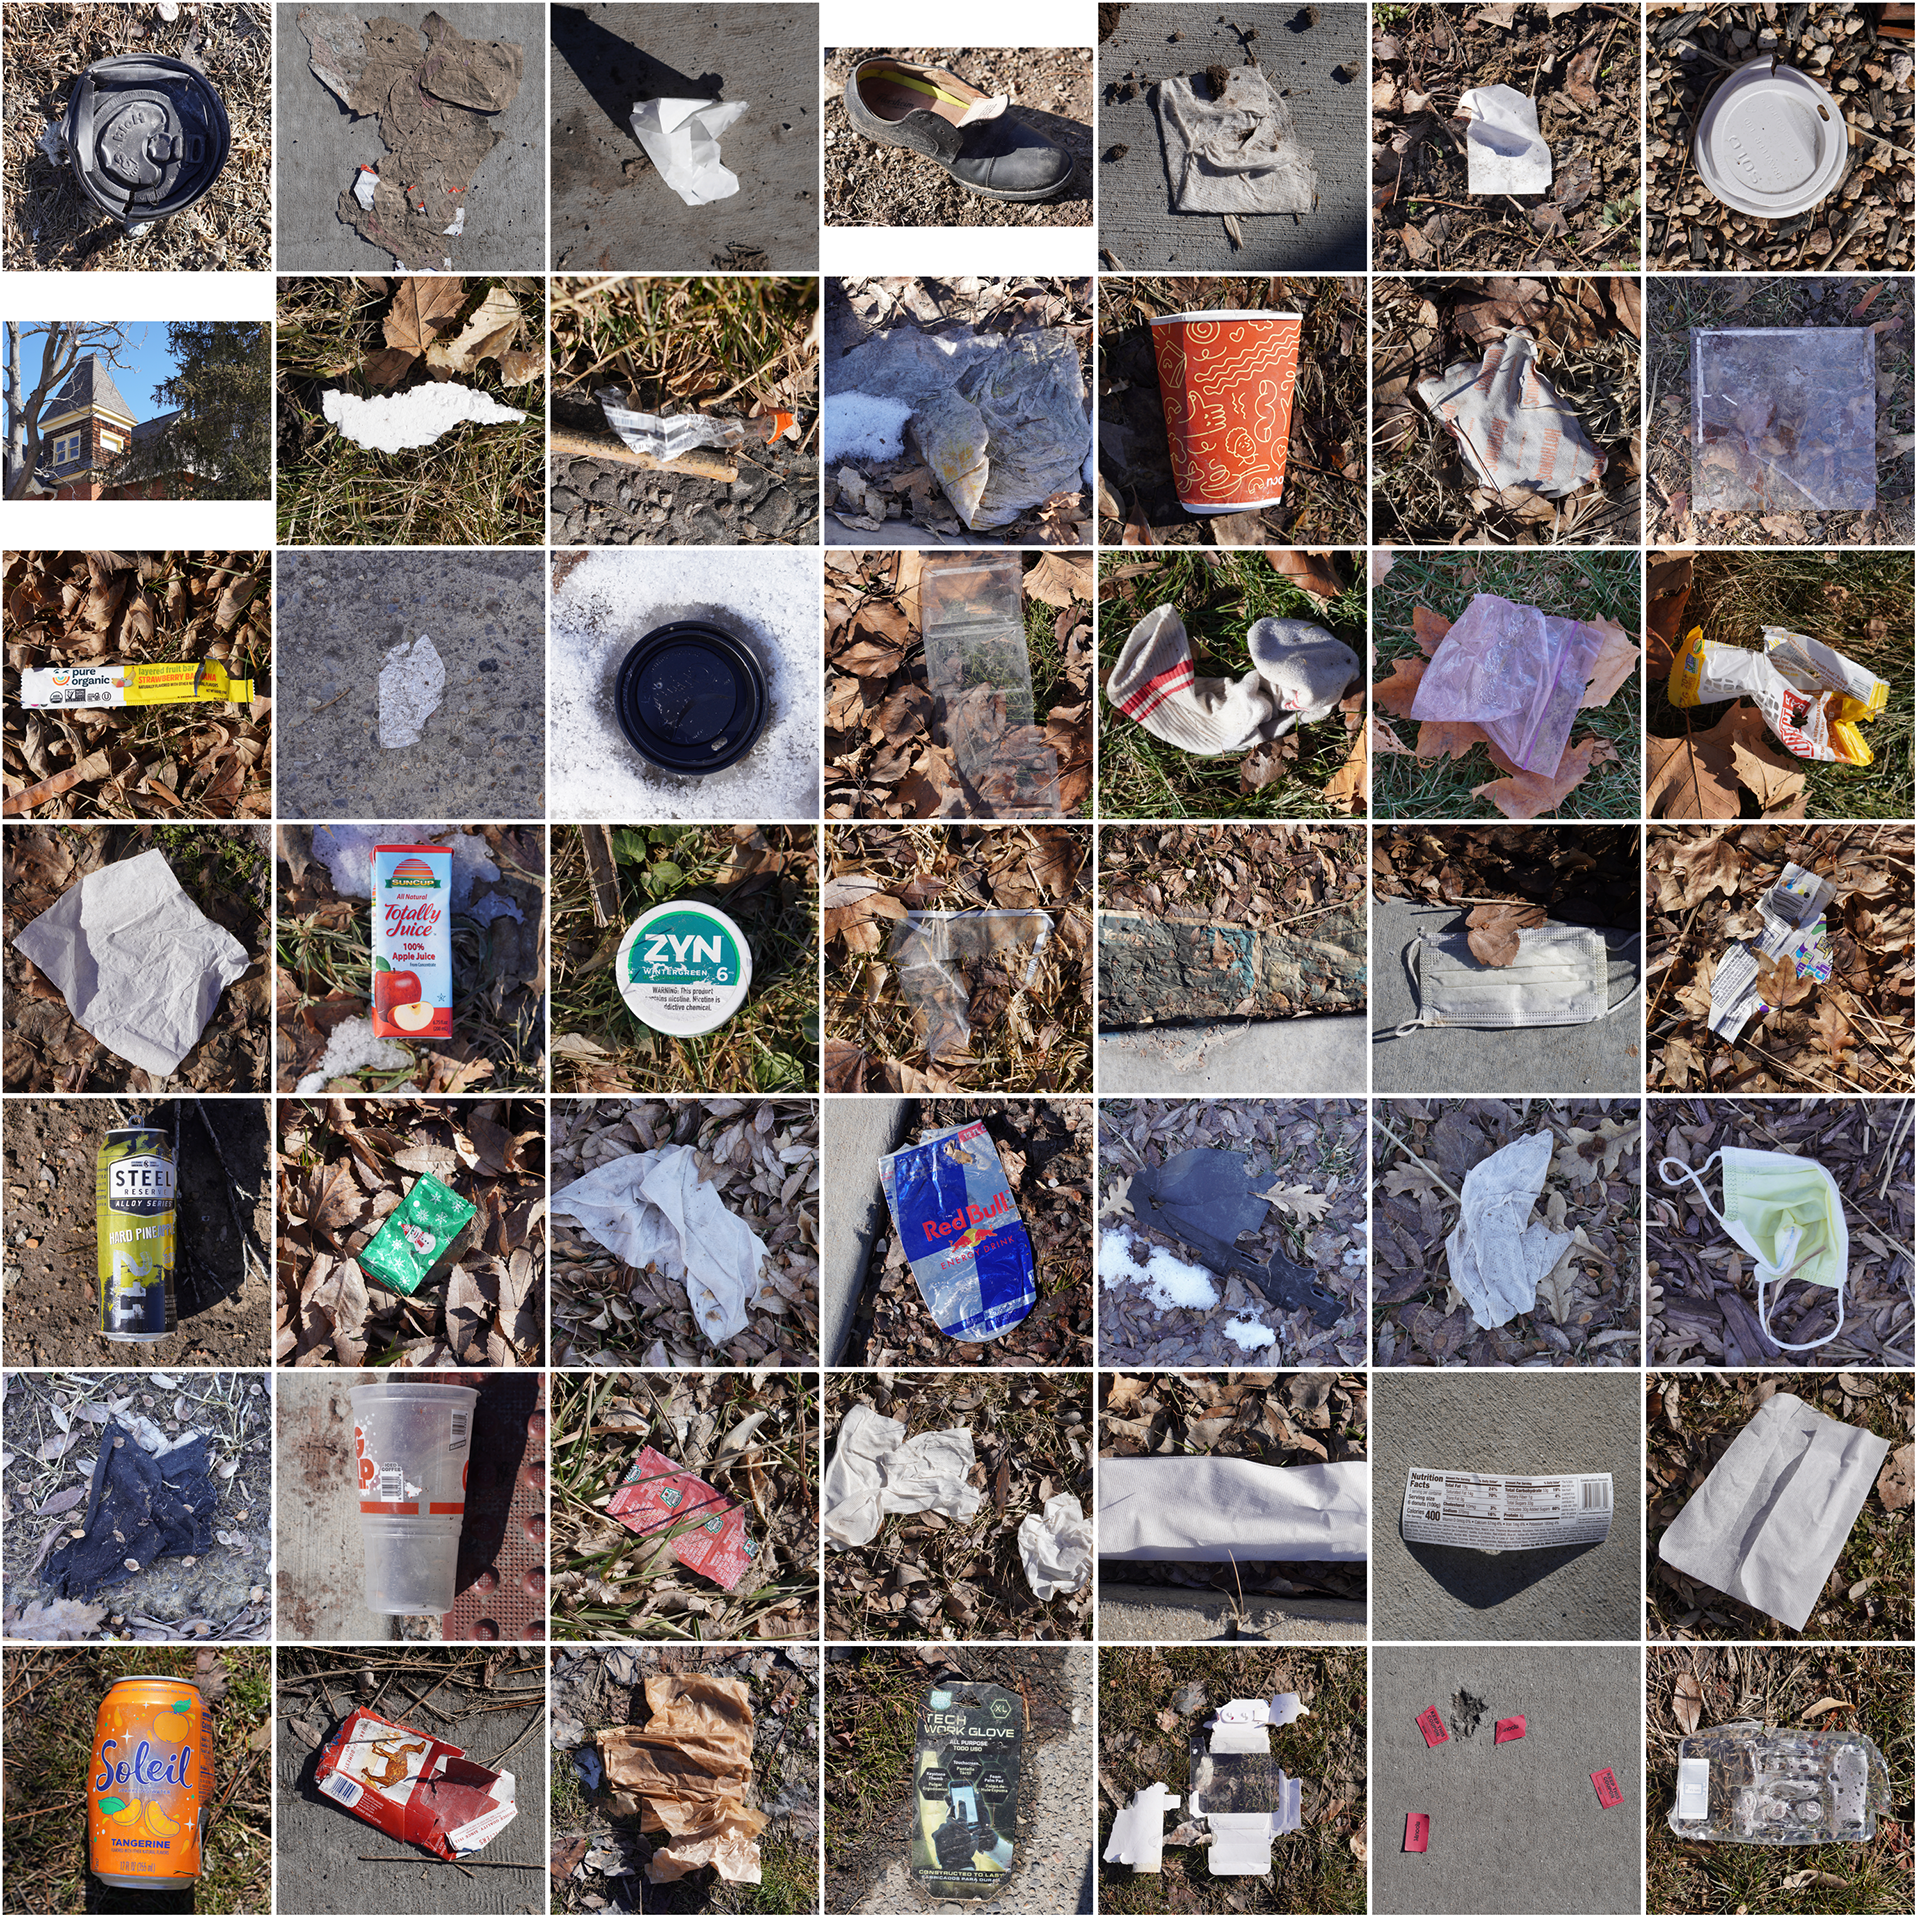
Using a Maverik Gas station as an anchor point, this assignment asked us to spend time in the area surrounding the gas station and note what we observe.
I found Over 250 pieces of trash found in two square blocks.
Design research Question:
How can the trash be categorized to better understand it and its surroundings?


Documentation
1. Observe trash
2. Photograph
3. Record information
Information
Brand: Maverik
material: Plastic
category: Cups
coordinates: 40.76275, -111.86791
Resource: AllTrails Waypoint Feature
Data Entry and Formatting
The brand, material, category, and coordinates were recorded and then transferred to spreadsheets. The data was formatted using various macros in Excel.
mapping
The data points were entered into maphub.net and separated into categories in order to observe any relationships or patterns. Businesses in the area were also added to see if higher concentrations of their branded trash correlated to their geographical locations.
.
GRAPHS + CONCLUSIONS
RECYCLABLE VS.
NON-RECYCLABLE MATERIALS
Using the Salt Lake County Recycling Guidelines, of all of the materials gathered, only 12% were recyclable.
HEAT MAP
The heat map revealed that the area most saturated with trash was located around the Maverik gas station.
Maverik could consider providing more trash receptacles along the perimeter of its building to help cut down on the amount of trash that ends up on the ground.
BRAND OF TRASH
Much of the trash gathered was associated with no particular brand.
Of the brands that had more than five pieces of trash, three of them were located within the research area.
CATEGORY OF TRASH
Cups from the two gas stations in the area along with food wrappers made up a significant amount of trash observed.
If the two gas stations are interested in reducing their single-use waste, further research into incentive/reward programs for customers providing their own cup or mug would be a valuable place to start.

